Weather Graphs
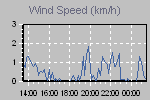
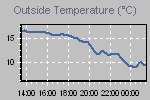
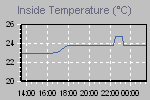
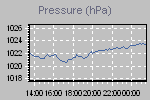
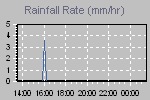
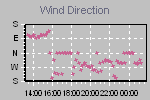
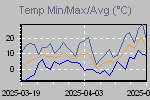
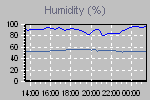
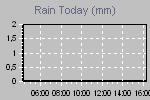
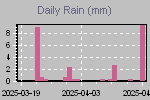
These graphs present temperature, pressure, rainfall, and wind speed trends for the last 12 hours .
The thumbnail graphs are sampled every 10 minutes. Click on a thumbnail to display the corresponding larger graph. The large graphs are sampled every minute.

| Click on a thumbnail to show a large graph in the panel above. | ||||
 |
 |
 |
 |
 |
 |
 |
 |
 |
 |
Page updated : 2025-06-11 07:06:54
powered by Cumulus 1.9.4 (1099)
Language
Current forecast

Forecast image
(next 12 hours)
Moon phase

Phase: Pe≥nia
Moon visible at: 100%